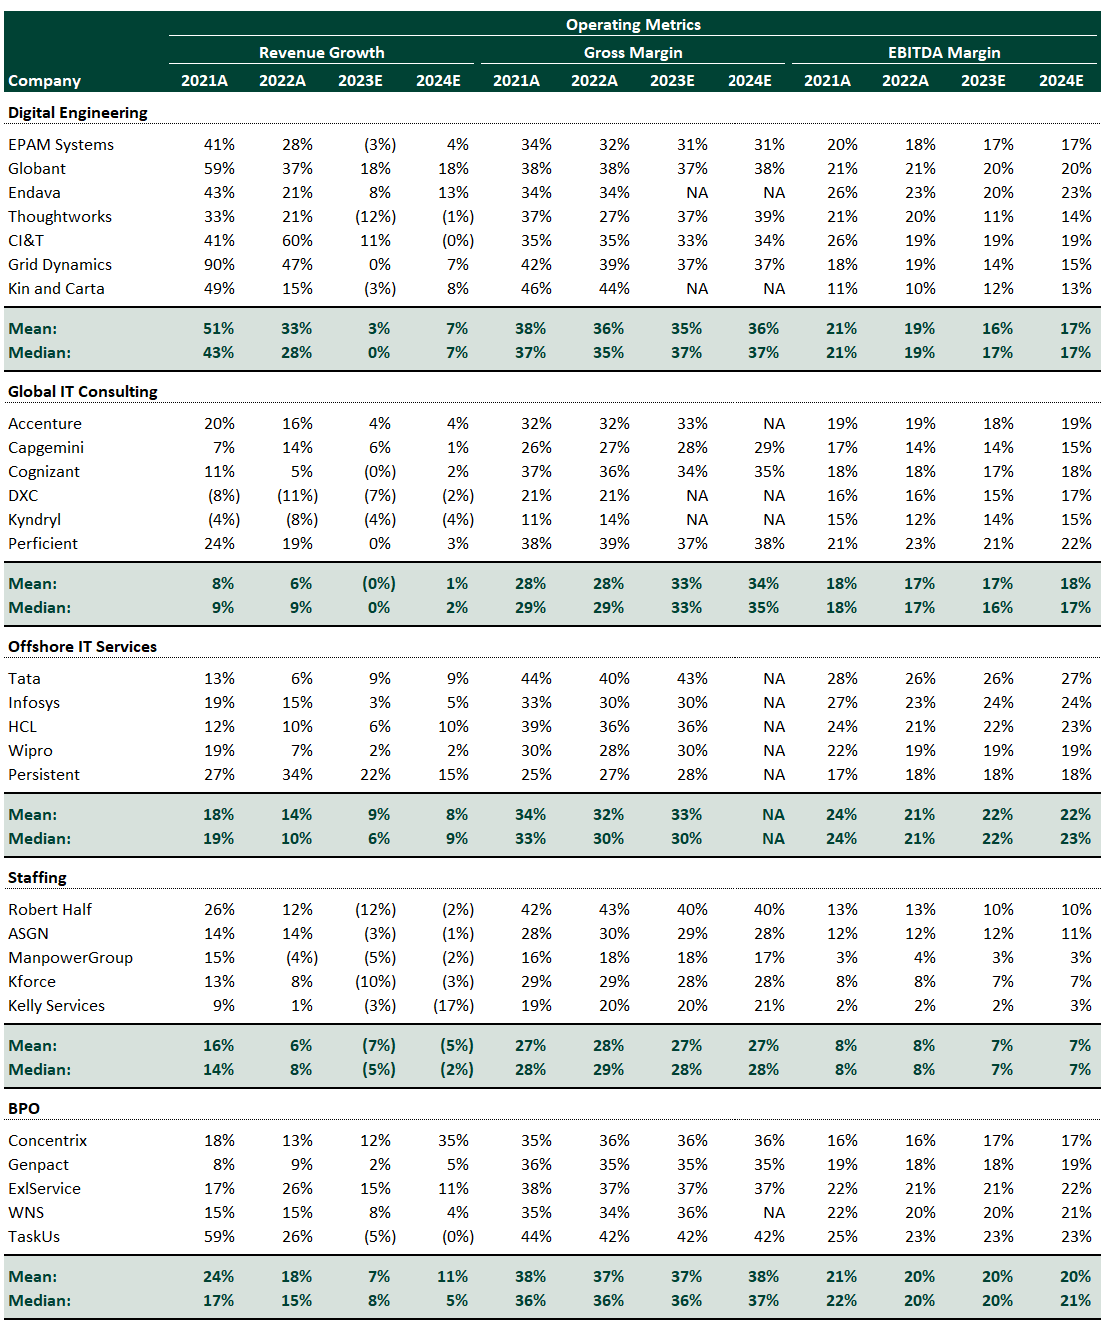
At Alten Capital, we are regularly asked for pointers for typical operating metrics of scaled technology services companies. Below is a summary of key operating metrics for technology services businesses in six spaces: Digital Engineering, Global IT Consulting, Offshore IT Services, Staffing, and BPO.
We’ve included relevant metrics like revenue growth, gross margin, EBITDA margin, capex / revenue, free cash flow margin (FCF), and FCF conversion from 2021 to 2024.
Growth slowed down in 2023 relative to prior years, and the market expects 2024 to be similar to last year. Gross margins remain stable across the board for each category. Companies stayed disciplined financially and stuck with their historical EBITDA margins.
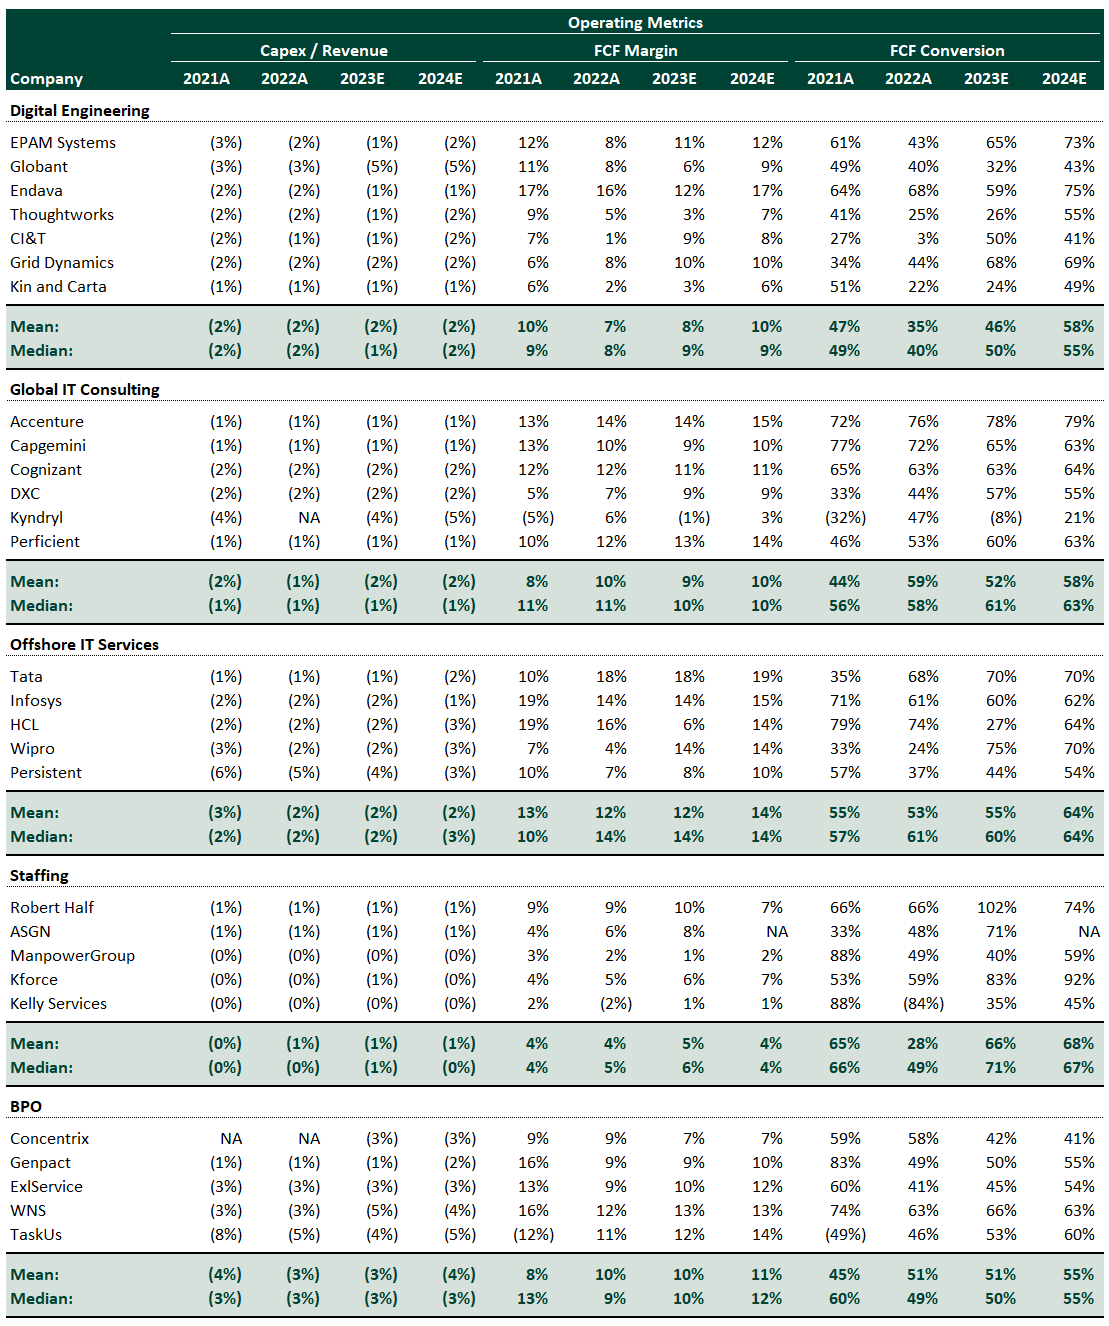
Capital expenditures (capex) divided by revenue indicate the amount these businesses invest in fixed assets to operate. IT services companies are generally asset-light and consume between 1% and 2% in capex.
Free cash flow (FCF) margin is FCF divided by revenue. This points to the amount the company generates per dollar of revenue in FCF. We calculated FCF as cash from operations minus capex. Depending on the category, businesses generate between 5% and 12% FCF margin. Note: It can also be called levered FCF as we have not stripped out debt/interest payments for the listed companies that have debt.
Lastly, FCF conversion means the amount of FCF the business generates per dollar of EBITDA, or in other words, how much of EBITDA ends up as FCF for that particular company. FCF conversion ranges from 50% to 65% of EBITDA, depending on company characteristics.
At Alten Capital we invest in technology services businesses. Please reach out to us to explore a partnership to continue scaling your company.