Revenue per employee is a common metric used in multiple industries. The metric allows us to compare productivity among businesses. For talent-based companies, especially technology services organizations, RPE is key.
Technology services companies can differ significantly. The talent-centric nature of these businesses means their revenue is tightly linked to their headcount. A higher RPE could mean the services provided are of higher quality relative to other companies and that customers are willing to pay up for those services.
Location can also be a relevant factor affecting RPE for different services companies. For example, billing rates from different regions influence RPE. We typically rank billing rates from highest to lowest along the following lines if the end customer is in the US:
Highest - North America: domestic delivery, high cultural fit and communication, timezone alignment
Mid-High - Latin America: nearshore delivery, mid cultural fit and communication, timezone alignment
Mid-Low - Eastern Europe: offshore delivery, mid cultural fit and communication, timezone difference
Lowest - South Asia: offshore delivery, mid cultural fit and communication, timezone difference
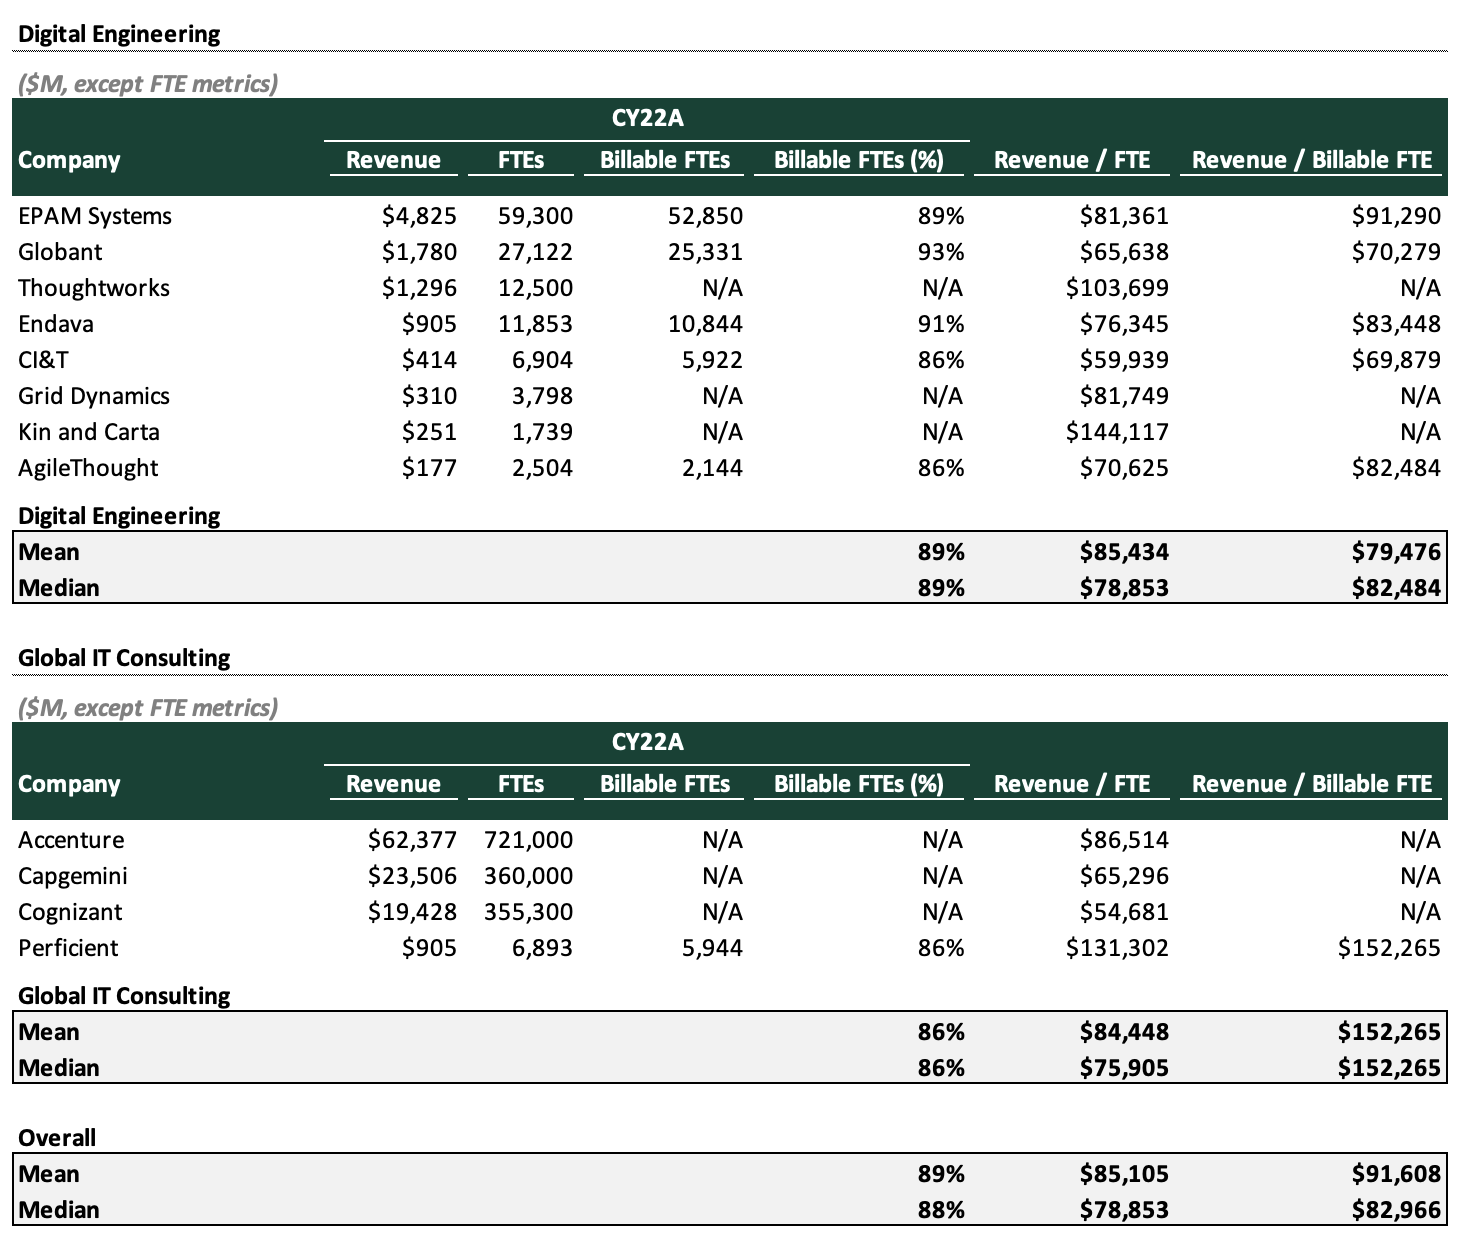
In the table above we list several digital engineering and IT consulting publicly-traded companies to compare their revenue per employee. We distinguish billable versus non-billable employees for the companies that disclose that information. This RPE data is an approximation, given the revenue figures are period-based while the headcount data is for a specific moment in time. Using headcount averages should make the calculation more accurate when the company is growing significantly.
Kin + Carta has the highest RPE with an estimated $144,000 revenue per employee per year, while Cognizant has the lowest RPE at an estimated $54,000 per year. Headcount footprint has a strong influence over these metrics. Another interesting metric is the ratio of billable versus non-billable headcount at these companies. On average, these companies have 89% billable employees and 11% non-billable headcount.
At Alten Capital we invest in tech and tech-enabled services companies. Please reach out to us to explore a partnership.