As companies mature and become larger, there could be less interest in exiting via M&A. This is not only because there could be fewer players of the appropriate size to acquire the business but also because shareholders may continue to see value in scaling the business and remaining independent.
In these cases, the public markets become a suitable alternative for partial shareholder liquidity. As a public company, the company's shares are traded constantly; therefore, the overall valuation is defined continuously. As I've mentioned before, the company is for sale every day!
Our focus on investing in technology services businesses makes looking at publicly-traded digital transformation companies interesting. These technology companies are not focused on the hardware nor the software layer but are centered around technology services like custom software product development, cloud engineering, software implementation, etc.
We have selected the following companies, ordered by market capitalization size, to do a quick valuation exploration: EPAM, Globant, Endava, Thoughtworks, CI&T, Grid Dynamics, and AgileThought. The image below shows the quick study results (bubble size reflects the relative market cap among these players).
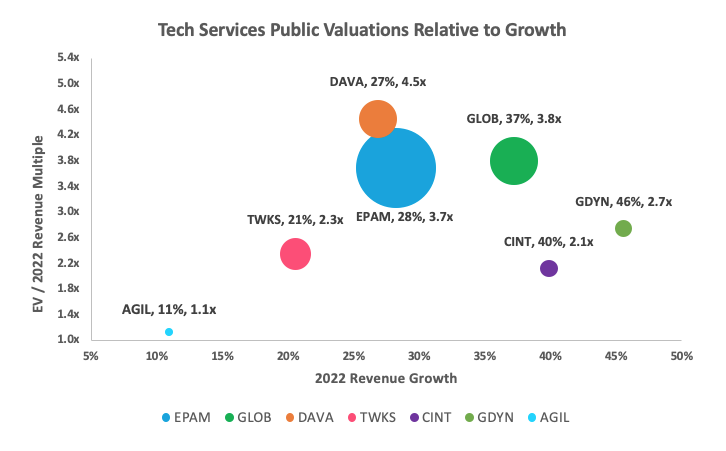
The labels of each bubble inform the ticker symbol of the company, its 2022 Revenue Growth rate, and its EV/2022 Revenue Multiple. For example, Globant is growing at 37% annually and is valued at approximately 3.8x 2022 Revenue, while CI&T is growing at 40% and valued at 2.1x sales. Globant is 8 times larger than CI&T in market cap and has an estimated 2022 revenue of $1.8 billion, while CI&T has an estimated 2022 revenue of $0.4 billion. 2022 revenue ranges for these companies go from EPAM, the largest, at approximately $4.8 billion, to AgileThought, at approximately $0.2 billion.
We did not draw a regression line on this chart. Still, the quick analysis can point to a directional "up and into the right" (from the lower left quadrant to the upper right quadrant of the chart) correlation between valuation and growth. The higher the growth, the more deserved the higher valuation a company would tend to have (all else being equal).
Not all tech service companies are the same, and valuations reflect additional company parameters not included in this simple examination. Other company-specific parameters that complete this financial picture could include type of revenue, quality of revenue, diversification, industries served, services rendered, geographical footprint, profitability levels, etc.
If you find this information useful, please contact us to start building a relationship. Our focus is on investing in technology services companies with North American revenue and global operations.