The Rule of 40 is a heuristic popularized by venture capitalists since 2015 to help guide software companies around revenue growth goals and appropriate profitability levels. The Rule of 40 (originally referred to as 40%) is the sum of a company’s annual revenue growth and profitability level. For example, if a software company grows at 15% and has a 20% EBITDA (or other operating income metric) level, then its Rule of 40 is 35%. Levels equal to or higher than 40 demonstrate a software company is executing successfully.
The idea behind this rule is that the magic level of 40 (or higher) appropriately balances revenue growth and profitability. It also implies that it is OK to sacrifice profitability to increase revenue growth or vice versa. A CEO could heavily invest in sales and marketing, lowering the company’s operating income and ideally materialize a higher revenue growth rate (e.g., 60% growth and -20% profitability).
Although it is a quick and convenient way to compare companies, the Rule of 40 may not be a universal way to view success at software companies of different scales or that operate in distinct industries/markets.
We can attempt to apply the Rule of 40 to technology services companies. To simplify this exercise, we took a set of publicly traded tech services companies and calculated the 2022 and 2023 Rule of 40. The table below shows the results.
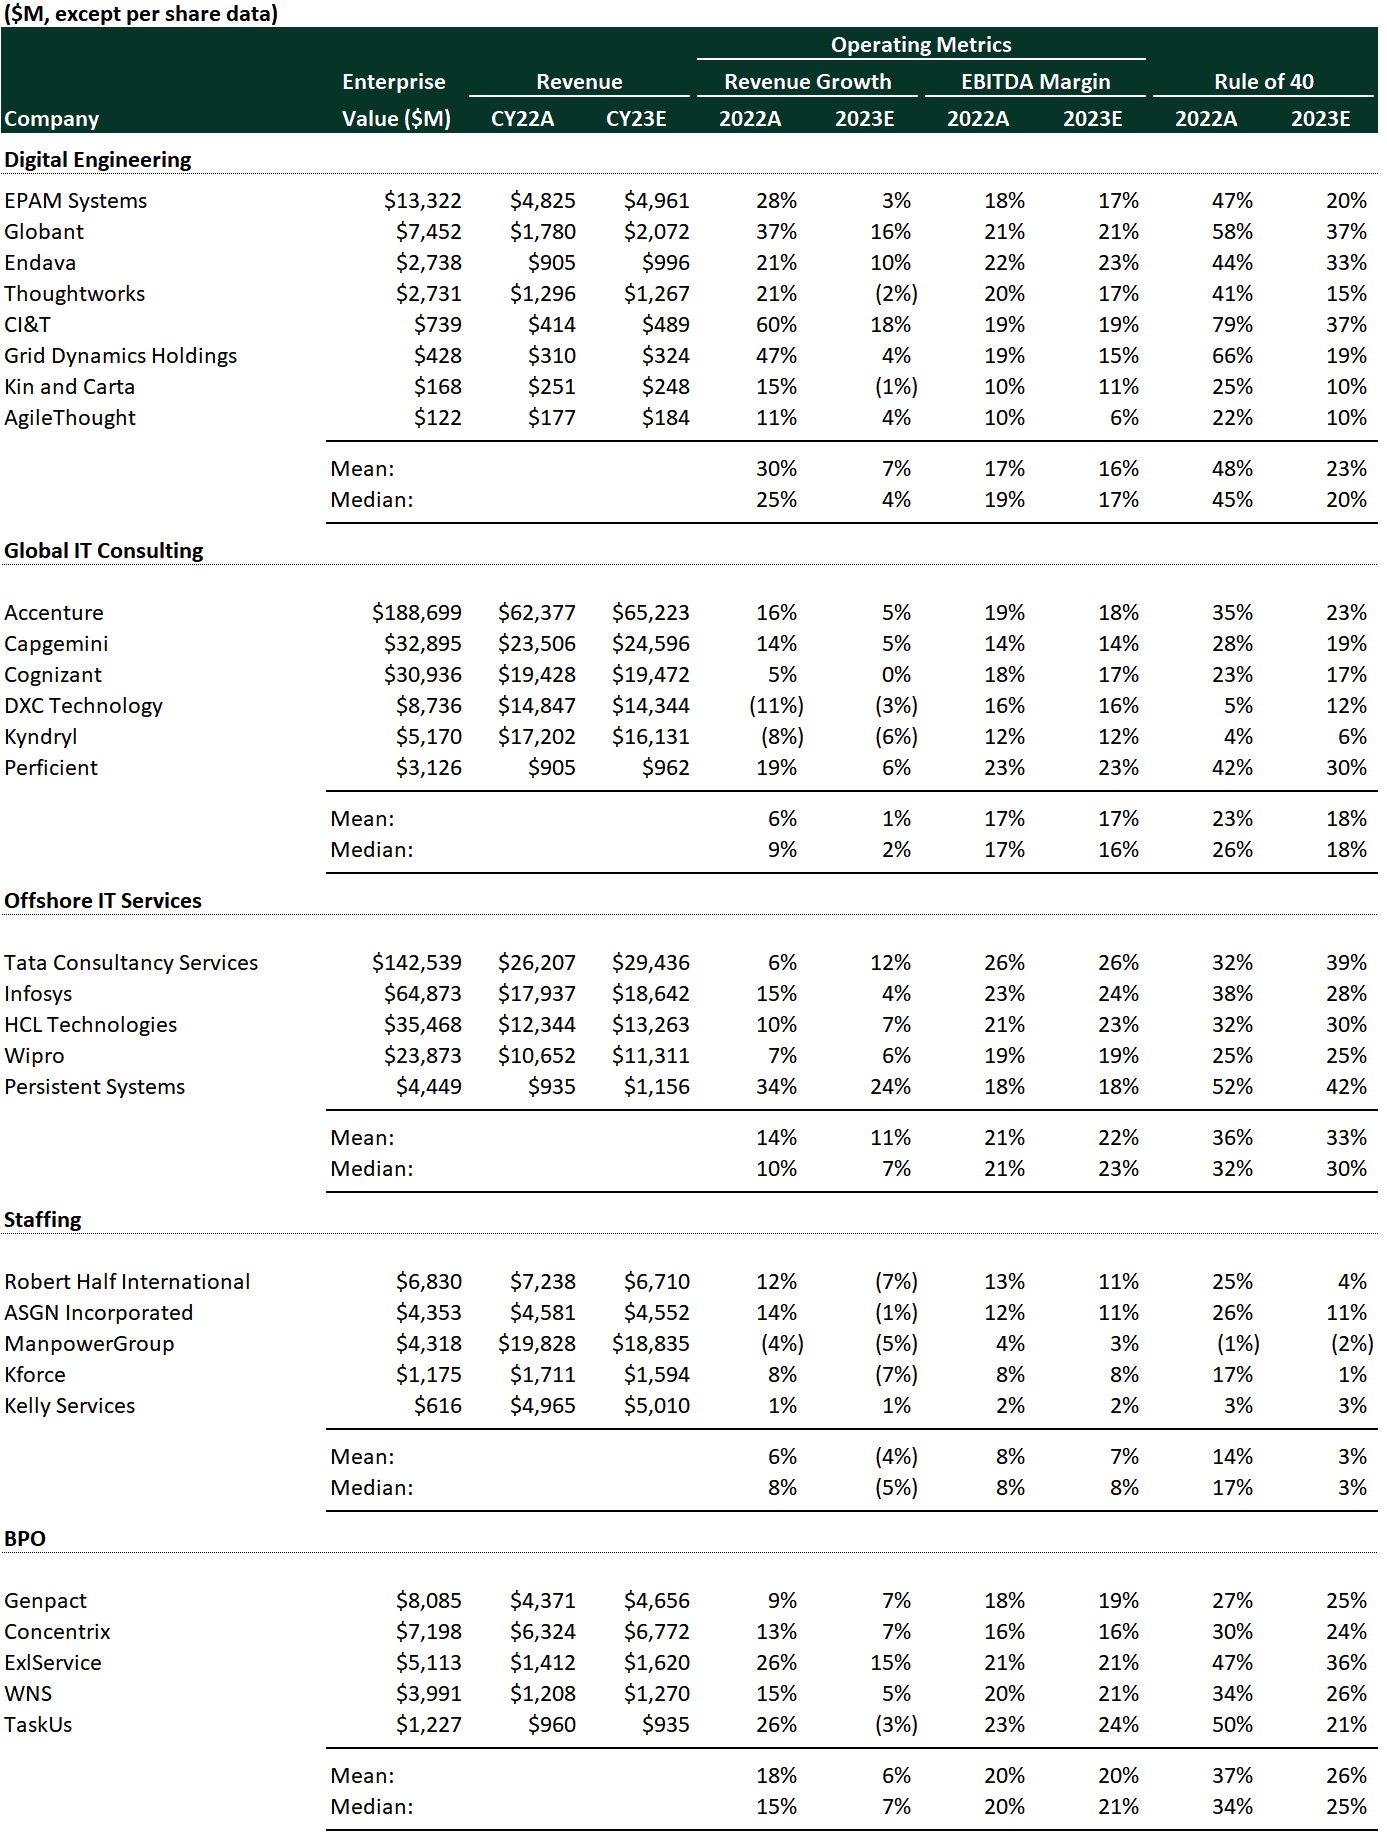
An initial observation is the stark difference between the 2022 and 2023 Rule of 40 metrics (last two columns). Profitability was kept rather constant, but revenue growth expectations decelerated significantly from one year to the next. Persistent Systems has the highest metric, 42%, while ManpowerGroup sports a -2% for 2023. On average, offshore IT companies have the highest Rule of 40 metrics, while the staffing names have the lowest.
A good question is if this Rule of 40 applies to technology services companies. Can services companies be measured with the same bar as their software peers? The answer may be that it depends. It is a useful guide that can help compare the operating performance of different organizations, considering their scale, type of business, etc.
At Alten Capital we focus on investing and scaling technology services companies. Please reach out to explore how we can partner.